
Education
01Economic Quantitative
Analytics
Master of Science
DePaul University
Economic Data Analytics
Bachelor of Science
DePaul University
ECONOMIC REASONING. EMPIRICAL RIGOR.
ECONOMICS · ANALYTICS · RESEARCH
Understanding a complex world,
through data.
I use econometrics and financial analysis to understand how shocks move markets, policy, and public opinion.
M.S. Candidate, Economic Quantitative Analytics
DePaul University
02 / CURRICULUM VITAE
Master of Science
DePaul University
Bachelor of Science
DePaul University
DePaul University
Kehoe Design
At the intersection of economic research and real-world analysis.
THE TOOLKIT
R · Python · Stata
SQL · SAS
Excel · Power BI
JavaScript · HTML · CSS
C# · Java
Power Automate · Power Apps
03 / RESEARCH
Exploring how shocks shape attitudes,
and whether data can reveal what comes next.
APPLIED ECONOMETRICS
A difference-in-differences study of how the 2015–2016 terrorist attacks in France affected political and social attitudes.
Did the attacks causally change French public opinion?
11 ESS rounds, 2002–2022 · ~322K observations · France + 13 control countries · World Bank GDP per capita, population, unemployment, and net migration · Global Terrorism Database fatalities.
Difference-in-differences, event study, controls, and robustness checks.
R · Stata
No significant immigration shift; France moved +0.256 rightward on the ideology scale.
Political shocks can affect values and ideology differently, and identification assumptions matter as much as coefficient size.
FINANCIAL ECONOMETRICS
A forecasting comparison testing whether machine learning can outperform classical time-series models on daily Rivian returns.
Can engineered macro and volatility features predict RIVN returns better than classical benchmarks?
613 daily observations, Jan. 2024–Jun. 2026 · 126-day out-of-sample test set.
ARIMA · ARIMAX · GARCH family · Random Forest.
R
Random Forest: best RMSE (.0305) and 64.3% directional accuracy.
Nonlinear combinations of market, volatility, and momentum features carried more signal than own-return time-series structure alone.
04 / SELECTED PROJECTS
From the world around us
to the stories that shaped it.
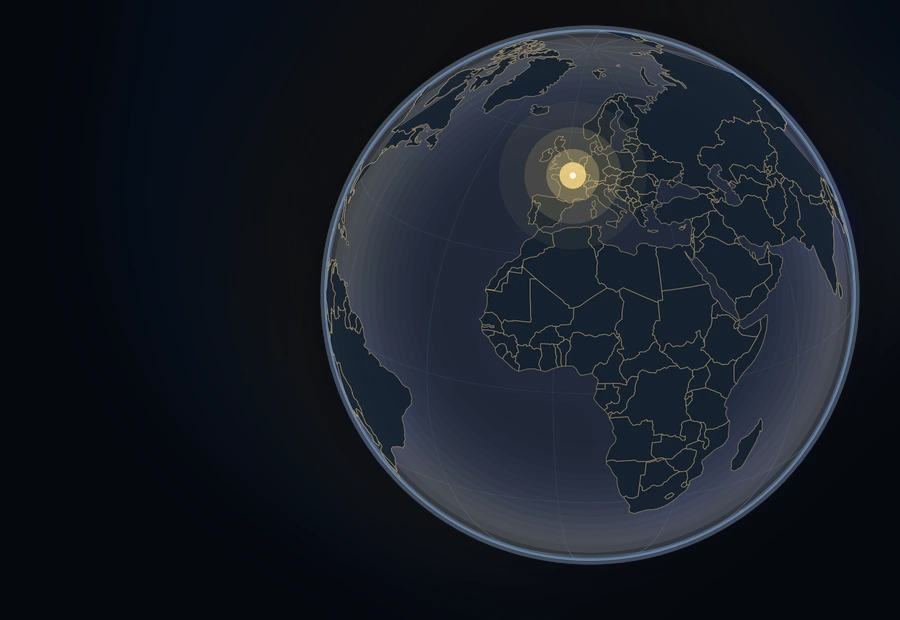
A browser-based geography game with multiple learning modes, daily challenges, streaks, leaderboards, and persistent player progress.

An interactive exploration of French history with chronological navigation, historical maps, and connected events through time.
05 / CONTACT
I’m always open to discussing research, analytics, projects, and interesting opportunities.
Let’s connect

